In this article I am going to explain you how to debug JavaScript or how to enable Script Debugging.
I have seen many people posting question in forum asking I am getting “Java script rut time error” and how to resolve this issue. Interestingly they post whole JavaScript also for the solution. With my experience it is bit hard to find out the actual issue in JavaScript if you are not able to find the exact line you are getting this exception.
Many people still not aware that we can debug JavaScript and find out the exact line where we are getting the script error.
To find the exact line where the exception is showing first we will enable the Script debugging in web browser. In this example I am using Internet Explorer.
To enable the JavaScript debugging in Internet Explorer follow below steps.
Open IE-->Go to Tools-->Internet Options—>Select Advanced Tab—>
Scroll down to Browsing section-->Un Check "Disable Script debugging (Internet Explorer)" and Uncheck "Disable script debugging (Other)" and Check "Display a notification about every script error".
Click Ok to save the changes.
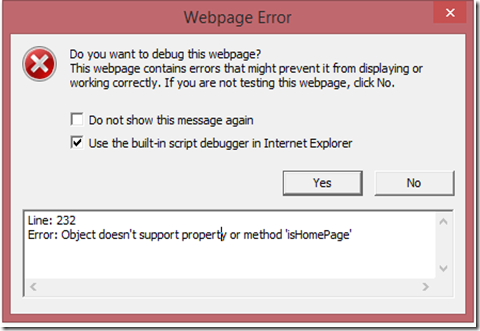
Now close your browser and open your web page and see the error message as pop up.
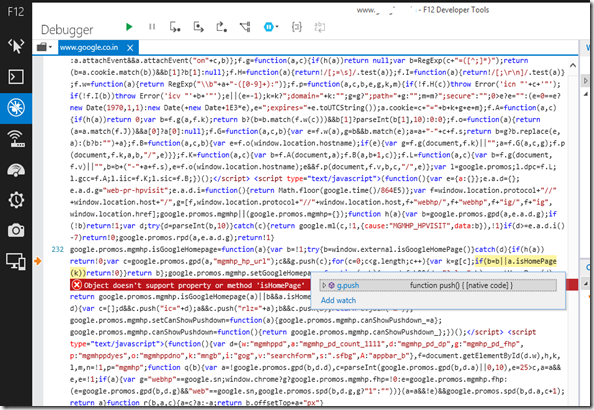
Click yes to open the script debugging and see in which line you are getting this error. Exact line you are getting this exception will be highlighted.
Now it will be very easy for you locate the line your script from your .aspx page.


1 comment:
This is an amazing blog,it gives very helpful messages to us.Besides that Wisen has established as Best Javascript Training in Chennai . or learn thru JavaScript Online Training India. Nowadays JavaScript has tons of job opportunities on various vertical industry.
Post a Comment